
76% Prime Event Growth for DigDefence Solutions, Then a TACoS Rebuilt from 30.79% to the Low Teens
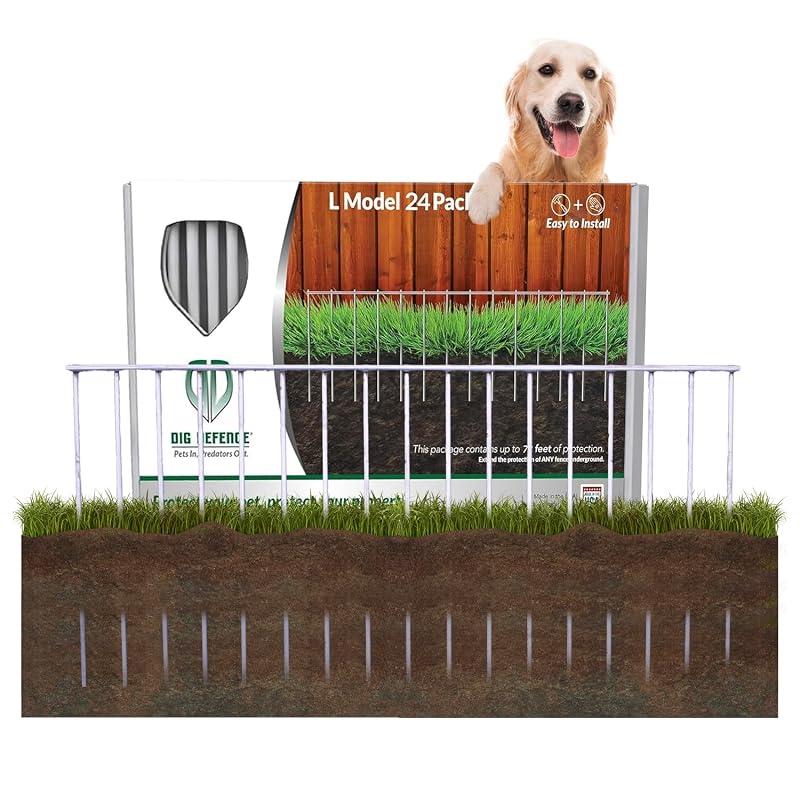
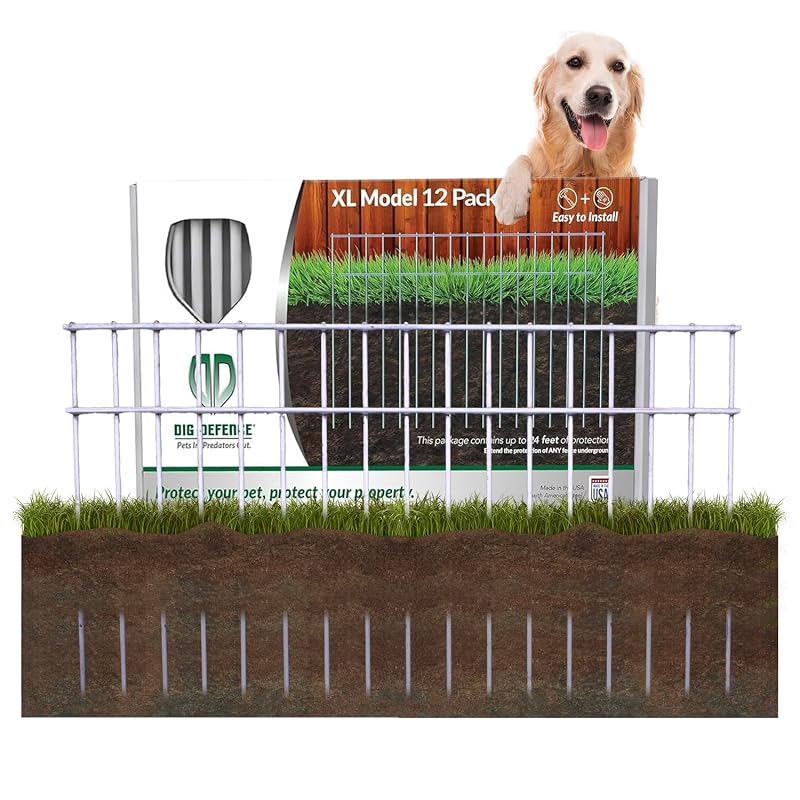

Pest control hardware in a mature category means the easy growth was already taken and each extra dollar of sales cost more than the last. The brand still needed year over year growth from a finite pool of high intent shoppers, and it had to do it while improving spend because the client measured TACoS as much as revenue. September 2024 made the gap obvious. The account was trending toward $70K against a $100K monthly goal while running a month to date TACoS of 30.79% against a 25% target, so it was missing the sales goal and overpaying for the sales it did get.
We paired relentless demand capture with new audience expansion. Continuous keyword extraction from research tooling and search query performance reports fed every relevant term into the ad plan, so we were always bidding against the freshest view of how customers actually search. On top of the ongoing campaign work, we enabled AMC audiences with several active tests to reach shoppers standard targeting misses, and we launched Sponsored Brands cross promotional campaigns so demand for one product line pulled the rest of the catalog with it.
July 2025 closed at $121.9K in ordered product sales, up 3.4% year over year with units up 2.8%, while TACoS ran 13% lower than the same month the prior year, so the account grew and got more efficient at the same time. The 2025 summer Prime event showed it clearest, with approximately 76% growth over the prior year's event because keyword coverage and audience work put the account in position to convert the surge it would have left on the table before. Across the full account year, total sales reached $1,021,922 against $975,371 the year before for a 4.8% year over year gain.
Efficiency Held Through a Hard Spring
The 2026 season brought a seasonal trough on top of a supply problem. February bottomed at $34,704, and the spring months ran below the prior year while the brand worked through stockouts on key products, which the reporting called out instead of burying.
"Stockouts are capping sales potential right now, and the lost availability is tracking to an estimated $27K in missed revenue."
April 2026 monthly summary
The job was to hold efficiency while volume struggled, and TACoS stayed between 10% and 16% through the whole stretch instead of drifting back toward the 30% baseline the account started from. That discipline paid the moment inventory recovered, because June 2026 surged 59.1% month over month to $124,997 and landed within 0.3% of the prior year while spending meaningfully less to get there.
"June closed slightly below YOY, yet the month ran more efficiently than last year, with nearly flat YoY revenue while spending $6K less in ads."
June 2026 monthly summary
"TACoS landed under target at 12.79%, which reflects tighter spend discipline and stronger efficiency versus last year."
June 2026 monthly summary
The momentum carried into July 2026, which reached $56,580 by mid month and kept the account on its recovered track.
Month by Month
| Month | Revenue | MoM | YoY | TACoS |
|---|---|---|---|---|
| Feb 2026 | $34,704 | -23.2% | -37.4% | 10.03% |
| Apr 2026 | $84,798 | -22% | -12% | 13.2% |
| May 2026 | $78,690 | -7.6% | -21.5% | 16.08% |
| Jun 2026 | $124,997 | +59.1% | -0.3% | 12.79% |
| Jul 2026 (through the 15th) | $56,580 | — | — | — |
These figures come from the monthly performance reports and the account performance sheet for this brand, and a blank cell means the report for that period did not state the number.
What It Proved
An account in a mature category measured against a 30.79% TACoS baseline now runs in the 10 to 13% range while defending revenue year over year, which means every dollar of ad spend works roughly twice as hard as it did when the engagement began. Efficiency that survives a stockout season was built into the account structure rather than borrowed from a good month.
← Back to all case studies